If you’re looking to make continuous improvements to your waste management practices, it might make sense to set your own benchmarks?
But what would this benchmark be? What does good look like? And is there an industry standard which businesses can measure themselves against?
So many questions, and after some hours spent crawling the worldwide web, not many answers. So, in the pursuit of understanding, I reached out to a number of agencies who manage, monitor or govern waste including The Environment Agency, LetsRecycle and Natural Resources Wales.
Here’s what I’ve found.
Current Plastic Recycling Rates in the UK
In 2014, 26% of all UK plastic waste was recycled. 55% was sent to landfill, 18% sent off to energy recovery (incineration) with the remaining 1% ending their life on our streets or in our rivers and oceans (as litter).
Projected Plastic Recycling Rates in the UK – short and medium term.
Based on a report commissioned by WWF, by the end of 2018 plastic recycling rates are expected to increase to 31%, and by 2030 this will further increase to 42%. Much of this increase can be accredited to policy change, such as the Packaging and Packaging Waste Directive, which specifies a packaging waste target of 55% by 2025.
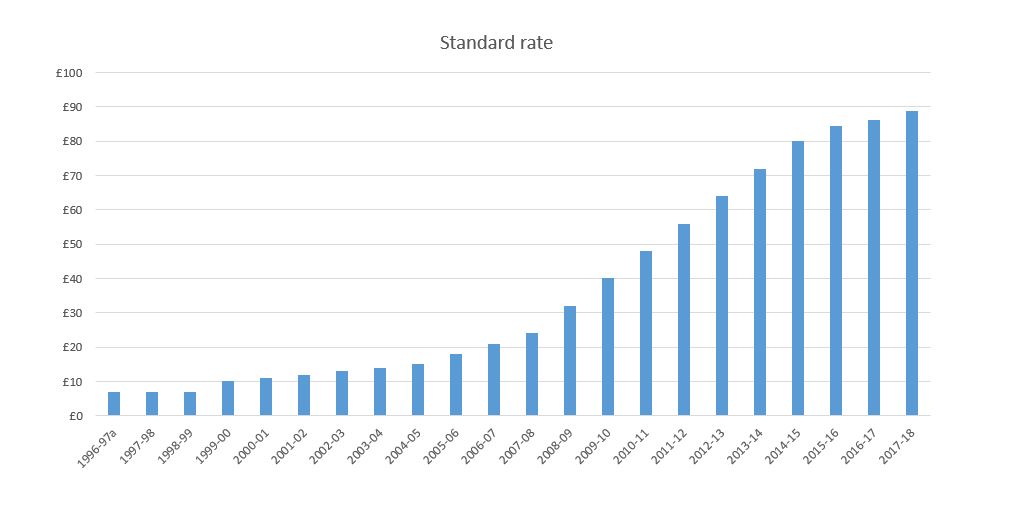
Something else that might affect the increase in plastic recycling rates of 42% by 2030 is the shift in focus away from landfill. Set out by the Waste Framework Directive revisions which include a maximum level of landfilling of 10% by 2030. To support this, there is a predicted increase from a current (2018) rate of 23% to 39% in 2030. The chart below shows how landfill costs (per tonne) have already increased since the 1990s.
Setting aggressive landfill targets, with financial penalties (a.k.a tax), can only be seen as positive. But is it that simple? With a shift change from landfill, where might our plastic waste end up if not in the recycling waste stream? The same report suggests a 16% increase to energy recovery.
Increased use of incineration is not necessarily good for the environment, and there is an increasingly strong case against it. Burning plastic creates harmful dioxins and if incinerators are inefficient, these leak into the environment. Those seeking to reduce their carbon footprint, as well as implementing zero to landfill, might also consider climate change as a reason to divert their waste away from energy recovery. After coal, incinerators are the most CO2 intensive form of generation.
Naturally, one might surmise that, recycling is the better option. Better for the environment. Better for the bottom line (profit).
So, back to the original question of what good looks like when it comes to plastic recycling rates at work.
It depends. It depends on the type of plastic. According to the research commissioned by WWF, the UK ranks 5th highest in the EU for consumption of single-use plastic.
As we know, plastic comes in all sorts, shapes and sizes. Some more hidden than others, but which single-use plastic products are the biggest issue or which product type can we easily identify in our workplace and therefore take steps to tackle it head-on.
Below is a table which sets out UK Plastic Consumption, it’s ranking within the EU28 and Litter Rate*
| Product | Consumption (2018) billion items | Ranking within the EU28 based on consumption per capita | Litter rate |
| Crisp Packets | 8.3 | 2nd | 3.7% |
| Cutlery | 16.5 | 2nd | 0.5% |
| Straws | 42.0 | 2nd | 3.1% |
| Stirrers | 44.1 | 2nd | 0.2% |
| Drinks cups & lids | 4.1 | 2nd | 13.1% |
| Food containers | 5.2 | 2nd | 5.1% |
| Sweet wrappers | 6.0 | 8th | 3.1% |
| Drinks Bottles | 10.1 | 9th | 6.9% |
According to a report commissioned by the Welsh Government in April 2018**, options for a Deposit Return Scheme (DRS) have been reviewed and the findings suggest that a recycling rate of 90% can be achieved. The Welsh Government intend to consult on an 80% (combined plastic) recycling target for local authorities. If Wales is to achieve an overall recycling rate of 80%, some material/item types will have to over-perform in order to compensate for those material/item types for which an 80% target would be extremely difficult.
Setting a plastics recycling rate for your business
With a ranking of 2nd highest consumer in the EU28, together with a fairly high litter rate (compared to the all product average of 7%), plastic cups and lids (a.k.a your single-use coffee cup) seems an obvious waste stream to tackle first. Yet, drinks bottles would come a close 2nd with it’s relatively high litter rate.
Single-use plastic cups / lids:
While data is poor, it is estimated that 237 million coffee cups and 183 million coffee cup lids are consumed annually in Wales, representing around 2,600 tonnes of coffee cups, and 550 tonnes of lids. To put this into a more digestible picture for you, it is further estimated that the volume of cups genuinely littered on the ground each year – not placed in a bin, but genuinely littered and subsequently picked up by local authorities – could fill five and a half Olympic swimming pools
It is estimated that only 0.25% are recycled at present.
Potential Recycling Target: Whilst the Welsh Government are considering a number of options inc, EPR (Extended Producer Responsibility) plus a 25p consumer tax, they believe setting a 30% reduction in use / litter waste is achievable.
Beverage containers (i.e. plastic bottles):
It is estimated that annual beverage container arisings in the local authority collected waste stream, of circa 105,000 tonnes, account for approximately 6.8% of this stream in Wales.
It is estimated that the Welsh recycling rate for plastic beverage bottles is 65%.
Potential Recycling Target: Again, whilst there are a number of options on the table inc. deposit return schemes (DRS), it is believed that a recycling rate of 90% with a DRS or 80% without is achievable.
SUMMARY
Based on the above, and an assumption that the behaviours of those in England, Scotland and Northern Ireland aren’t worlds apart from those in Wales, setting a plastic recycling target or benchmark of 80-90% for plastic bottles and a reduction in the volume of plastic cups/lids by 30% would be realistic.
At Unisan UK, we can help support your business with both of these targets. For single-use coffee cups (and drinks cans & bottles) we have CafeCrush™ and for everything else we have a wide range of recycling solutions from bespoke recycling stations or hub, through to indoor office recycling bins.
Keen to learn more?